Skip Links
Navigation: MESYS Hertz Calculation > Results > Result Graphics
The orthogonal shear stress is shown in a 2D color plot over the minor and the major axis of the contact ellipse.
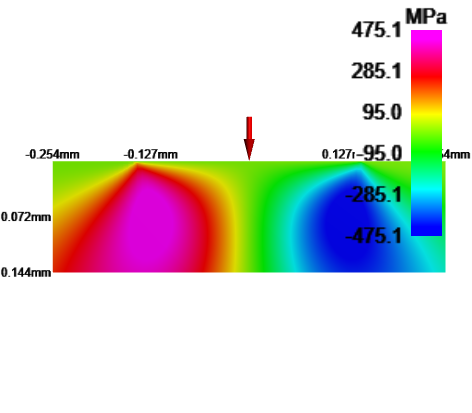 The orthogonal shear stress is shown in a 2D color plot over the minor and the major axis of the contact ellipse.
 The orthogonal shear stress is shown in a 2D color plot over the minor and the major axis of the contact ellipse.