A load spectrum can be used instead of a single load case. This option can be activated here. For each load case a full calculation using all factors is made. The resulting life is calculated using the life of each element as .
Result graphics are only shown in the report for the selected result element of the load spectrum. However, the result graphics corresponding to any element number (load case) of the load spectrum can be shown under the menu ‘Graphics’->’Load spectrum’, as we can see in this picture:
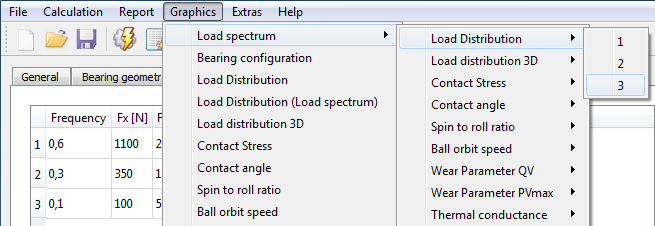
All other graphics available under the menu ‘Graphics are only valid for the selected element.
Additionally, under ‘Graphics’->’Load distribution (Load spectrum)’, all the load distribution cases are superimposed on the chart at the same time. This is also possible for the roller graphics.
Please note that more intermediate results are printed in the report if a calculation is done for a single load case.