Navigation: General > Statistical parameter variations
Graphics
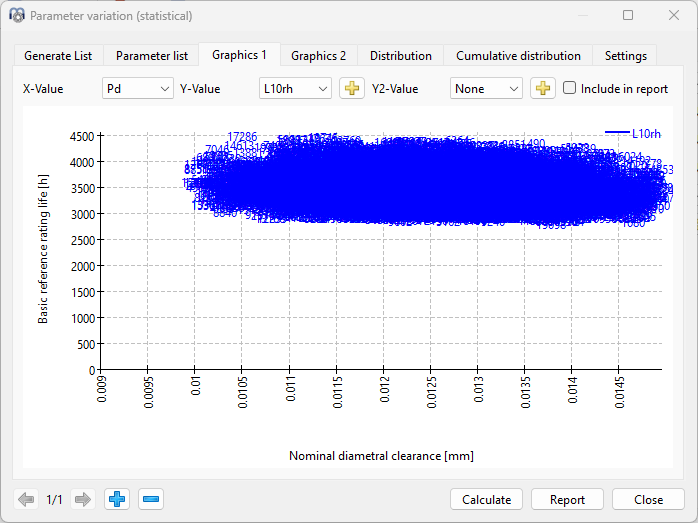
On the tab-pages ‘Graphics’ any variable combination can be visualized in the form of point clouds, where some trends for the relationship between the parameters might be recognized, as shown in the picture below.