On the pages “Graphics1” and “Graphics2” the results can be shown as graphic.
If the parameter list was generated by “Generate list” and no more than two input parameters are used, lines are used for the diagram. For more parameters or other sources just points are shown.
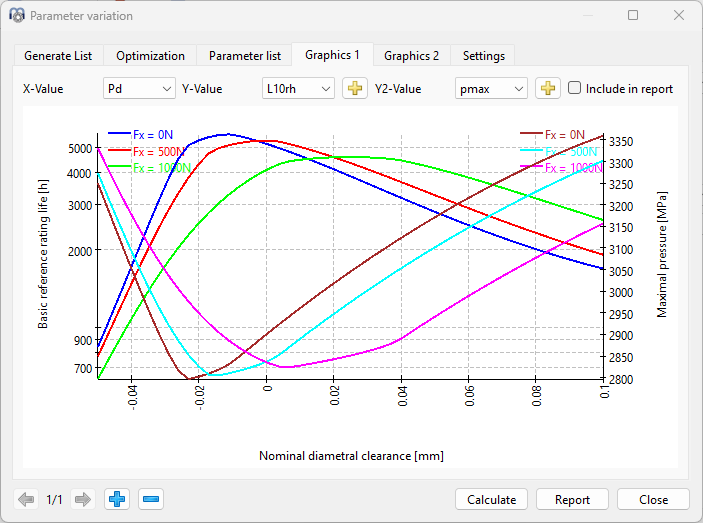
In case two parameters had been varied on "Generate list" multiple curves for the second parameter are shown like in above image showing a variation of nominal clearance and axial force Fx.
The graphic area consists of two different y-axis, thus being possible to compare different types of output results (units) at a time. Furthermore, although the basic life (L10rh) is being primarily analyzed in the graphic, by doing a click on the  -button, it could also be possible to add any other outputs with the same units like Lnmrh of one of the two available y-axis.
Under "Settings" an option is available to include input and output values in selections for both axes. This would also allow to swap horizontal and vertical axis.